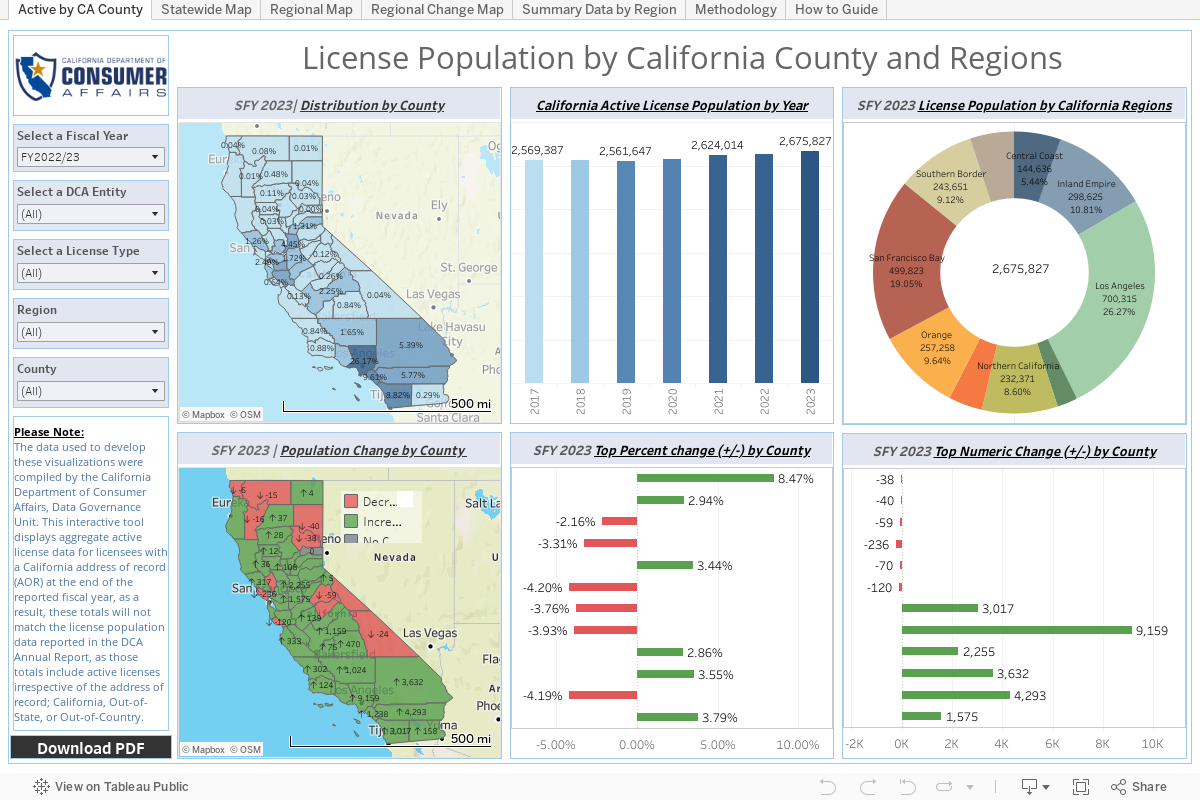
Active License Population by County
The DCA license population by county interactive map displays the distribution of DCA’s active licensee population across all 58 California counties. The map also shows the annual change in the active license population from year-to-year for each of these counties.